|
|
|
|
|
|
|
|
|
 Posted: Mon Jan 16, 2012 3:08 pm Posted: Mon Jan 16, 2012 3:08 pm
Im honestly starting to think I have some sort of issue with anxiety or something. Every night before the start of the school week I get extremely worried and feel uneasy about everything. It is a bother and arugh I don't like it.
|
 |
|
|
|
|
|
|
|
|
|
|
|
|
|
Posted: Mon Jan 16, 2012 3:16 pm
Cabron LaSwan xd
Will somebody get this man a b*****b? 
|
|
|
|
|
|
Sharkbutt The Orgiastic Crew
|
|
|
|
|
|
|
|
|
|
|
|
Posted: Mon Jan 16, 2012 3:26 pm
Sharkbutt The Orgiastic Cabron LaSwan xd
Will somebody get this man a b*****b? No. Flattered, though.
|
|
|
|
|
|
|
|
|
|
|
|
|
|
|
Posted: Mon Jan 16, 2012 3:27 pm
Carchar-odin Sharkbutt The Orgiastic Cabron LaSwan xd
Will somebody get this man a b*****b? No. Flattered, though.
|
|
|
|
|
|
|
|
|
|
|
|
|
|
|
|
|
|
Posted: Mon Jan 16, 2012 3:29 pm
l-Kathulu-l Carchar-odin Sharkbutt The Orgiastic Cabron LaSwan xd
Will somebody get this man a b*****b? No. Flattered, though.
|
|
|
|
|
|
|
|
|
|
|
|
|
|
|
Posted: Mon Jan 16, 2012 7:08 pm
l-Kathulu-l Im honestly starting to think I have some sort of issue with anxiety or something. Every night before the start of the school week I get extremely worried and feel uneasy about everything. It is a bother and arugh I don't like it.
|
|
|
|
|
|
|
|
|
|
|
|
|
|
|
|
|
|
Posted: Tue Jan 17, 2012 1:10 pm
That feel when one of your favorite songs comes on in the car but you're driving someone around so you can't just ******** sing your heart out
crying
|
|
|
|
|
|
|
|
|
|
|
|
|
|
|
Posted: Tue Jan 17, 2012 3:26 pm
The Betman That feel when one of your favorite songs comes on in the car but you're driving someone around so you can't just ******** sing your heart out crying I do not know this feel. (I sing anyway and give zero ********)
|
|
|
|
|
|
|
|
|
|
|
|
|
|
|
|
|
|
Posted: Tue Jan 17, 2012 5:15 pm
Decavolty The Betman That feel when one of your favorite songs comes on in the car but you're driving someone around so you can't just ******** sing your heart out crying I do not know this feel. (I sing anyway and give zero ******** class="clear"> true story: it was plush
|
|
|
|
|
|
|
|
|
|
|
|
|
|
|
Posted: Tue Jan 17, 2012 5:17 pm
The Betman Decavolty The Betman That feel when one of your favorite songs comes on in the car but you're driving someone around so you can't just ******** sing your heart out crying I do not know this feel. (I sing anyway and give zero ******** class="clear"> true story: it was plush O:
|
|
|
|
|
|
|
|
|
|
|
|
|
|
|
|
problematic briefcase Crew
|
Posted: Wed Jan 18, 2012 1:27 pm
My aunt is getting married. Dunno when, but I already know I wont be able to go, even though I'm in good terms with her and her fiance. They've been dating for like, six years or almost seven. I can't go because the wedding is in Hawaii. I don't have a job to pay for the motel room, the plane, or the money that you would need when you pretty much vacation. Nor do I have a passport.
Oh well. It'd be a great incentive to get a job, but I can barely hold on for more than five months before I ******** it up.
|
|
|
|
|
|
|
|
|
|
|
|
|
|
|
Posted: Thu Jan 19, 2012 6:18 pm
Amber got back with me about that artist's username. It is TappyNappy.
|
|
|
|
|
|
|
|
|
|
|
|
|
|
|
|
|
|
Posted: Thu Jan 19, 2012 8:40 pm
-Dessynea- Amber got back with me about that artist's username. It is TappyNappy. I found her art thread. Thanks!
|
|
|
|
|
|
|
|
|
|
|
|
|
|
|
Posted: Fri Jan 20, 2012 1:06 am
Is There a Significant Relationship Between The Frequency of Arrow-In-the-Knee Jokes and CarcharOdin’s Anger Levels?
A Statistical Regression Analysis by CarcharOdin DETERMINE THE VARIABLES
Before we conduct the study, we must first identify the dependent and independent (or response or explanatory) variables of the study. An independent (explanatory) variable is the set variable in study that determines the magnitude of the dependent (response) variable. For example:
2x+1 = y
X is the independent variable and y is the dependent variable. So if we make x=2:
2(2)+1 = y
Then that determines the value of y, which ends up being 5. Ergo, the magnitude of y depends on the magnitude of x, which we, the experimenters set as 2.
In the case of this study, we are trying to find if my anger levels are dependent on the frequency of arrow-in-the-knee jokes. Therefore, the frequency of arrow-in-the-knee jokes is the independent variable and my anger level is the dependent variable.
STATE THE NULL AND ALTERNATIVE HYPOTHESES
In a study, we must state the hypotheses of the experiment. A hypothesis is a proposed explanation to a phenomenon that must be tested and verified. However, did you know that there are more than one hypothesis? Crazy s**t, huh? A null hypothesis (Ho) is a default or general conclusion that is normally expected of a phenomenon. An alternative hypothesis (Ha) is the explanation we are trying to prove, in which case it is the opposite of a null hypothesis.
In this case:
Ho: There is no significant relationship between the frequency of arrow-in-the-knee jokes and CarcharOdin’s anger levels.
Ha: There is a significant relationship between the frequency of arrow-in-the-knee jokes and CarcharOdin’s anger levels.
Now, of course the null is theoretical in this case, as I have a tendency to get pissed off at various things, but for the sake of the study, just go with it.
CREATE A LINEAR MODEL
First, we need data. Don’t worry, I’ve got that covered. I’ve taken data I collected and created a chart with a best fit linear model, denoted by the blue line: 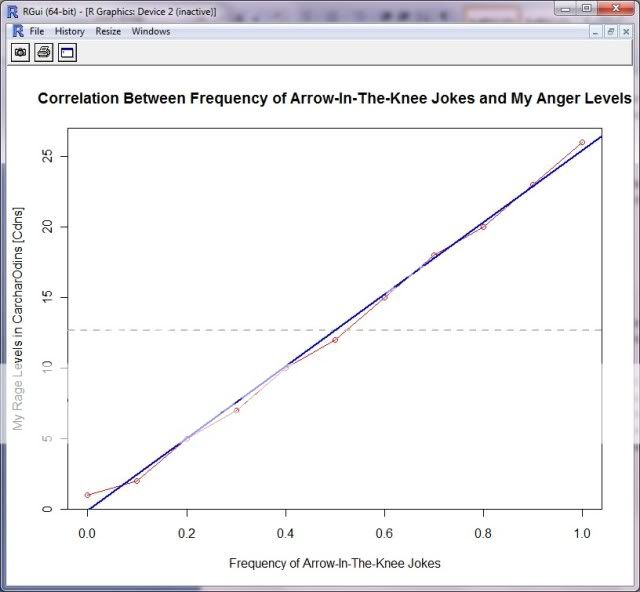
As we can see, the line of best fit has a positive slope. However, this does not yet prove if there is a relationship. Next we must conduct normality and variance tests.
NORMALITY, VARIANCE, and OUTLIERS TESTS
First, we test for the assumption of normality of the residuals. What this means is that the distribution of the residuals must be normal (little to no outliers and relatively symmetrical). In regression analysis like this, we use a QQ-Plot: 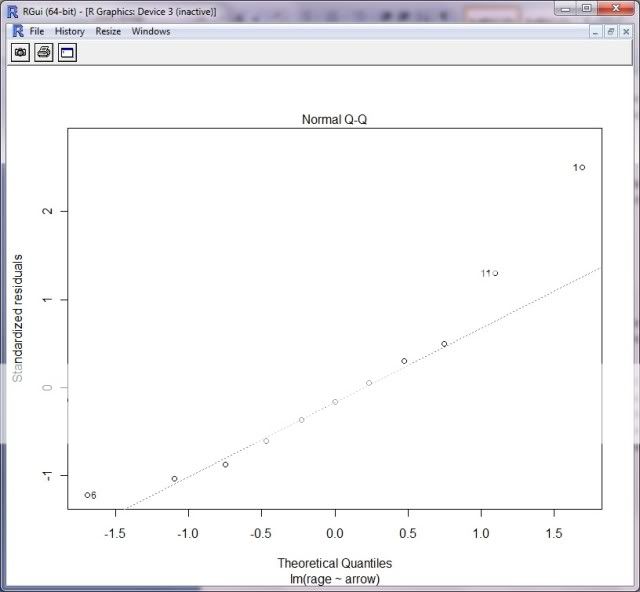
Shapiro-Wilk normality test
data: residuals(df.lm.r)
W = 0.9354, p-value = 0.4679
Since the p-value is greater than a set significance level of 0.05, we fail to reject the null hypothesis that the residuals are normally distributed. In short, the assumption of normality of the residuals has been met. This test passes.
Now, we need to find out if there is Constant Variance in the Residuals and the Independence of Residuals. What this means is that we want the variance in the values of the dependent variable to be the same regardless of the value of the independent variable and we also want to see if the residuals do not depend on the fitted values. To do this, we look at how the fitted values vary with the residuals. For those of you who are wondering what a residual is, it’s basically the difference between an observed value and a corresponding value given by the line of best fit. So, we created a fitted vs residuals plot: 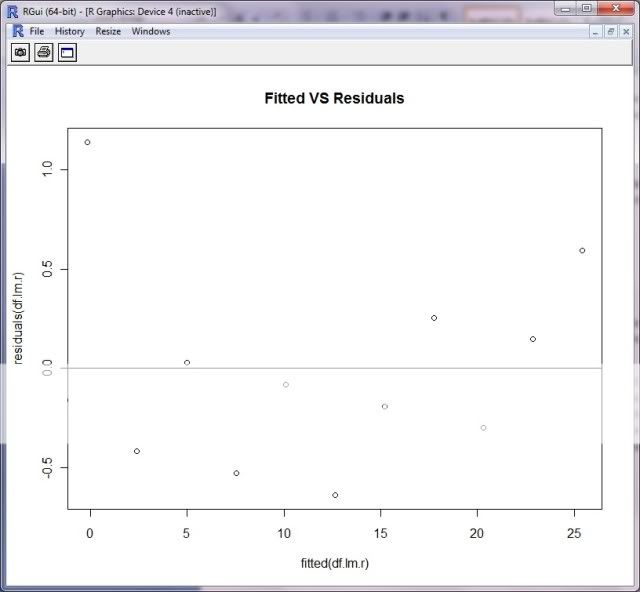
Finally, we have the test of Outliers/Influential Points. We do not want there to be any significant outliers (which, by the way, are extreme values distant from the rest of the data; they skew the data to a degree if there are enough of them) in the data. The default method of doing this in R is Cook’s Distance: 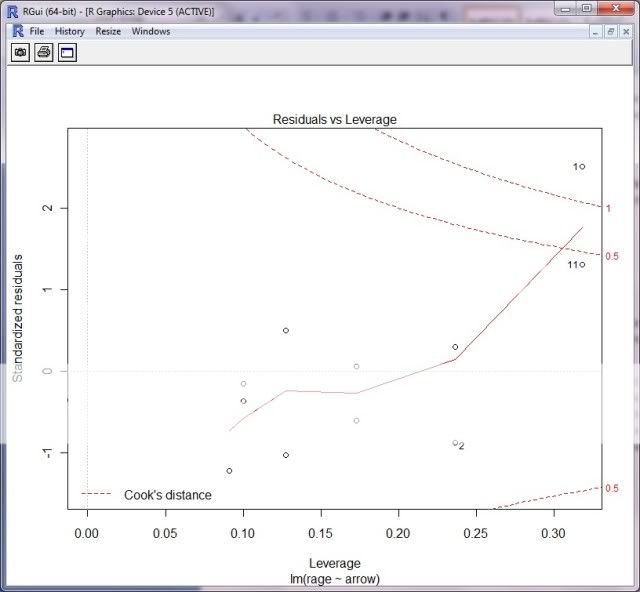
NOTE: If any of these tests would’ve failed, I would either have had to call it quits or transform the initail data (usually via log10).
SUMMARY, FORMATION OF LINEAR EQUATION, AND CONCLUSION:
Now that all of the tests of normality, variance, and outliers tests have passed, we now must conduct a summary of the data. Since I’m using R, this will be piss easy. I use the summary() function and voila: 
Since “arrow” is the independent variable, the coefficient for it is 25.5455. The (Intercept) is -0.1364. Therefore, we can conclude that the linear expression for the relationship between the frequency of arrow-to-the-knee jokes and my anger levels is:
y = 25.5455x – 0.1364
Where:
x = frequency of arrow-in-the-knee jokes
y = CarcharOdin’s anger levels (in Cdns; CarcharOdins)
Now, in order to determine if there really is a relationship, we need to conduct a 1-Way ANOVA test to determine the p-value. A p-value is the probability of getting a test statistic as extreme or more extreme as the one observed in this study if we were to conduct the study multiple times, assuming the null hypothesis (as stated above in the HYPOTHESES section) is true: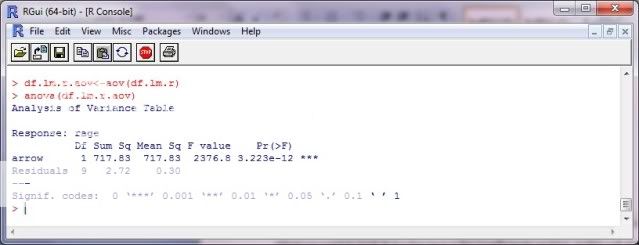
Since the p-value of this anova is 3.22e-12, far below the significance level, we can conclude that there is little probability that we would get these observed values if the null is true. Therefore, we can conclude that the null is false and the alternative hypothesis is true. We hereby reject the null.
So, in conclusion, based on the regression analysis and the anova test, we reject the null hypothesis and conclude that there is in fact a significant relationship between the frequency of arrow-in-the-knee jokes and my anger levels (as expressed in Cdn’s) and it goes in the positive direction. The linear equation is y=25.5455x – 0.1364. (t=48.75, sig.level = 0.05, p-value < 0.05).
REFERENCES
Lyman Ott, R., Longnecker, M. (2010). An Introduction to Statistical Methods and Data Analysis, Sixth Edition. Belmont, CA: Brooks/Cole Cengage Learning.
http://www.statsoft.com/textbook/elementary-statistics-concepts/
http://www.stats.gla.ac.uk/steps/glossary/paired_data.html
TL;DR (which makes you a s**t-eater):
There is a significant association between the frequency of arrow in the knee jokes anywhere on the internet and my anger levels. It goes in a positive trend, meaning the more jokes there are, the angrier I become. Knock it the ******** off. It isn’t funny anymore.
|
|
|
|
|
|
|
|
|
|
|
|
|
|
|
|
|
|
Posted: Fri Jan 20, 2012 4:34 am
>go to sleep at 9PM (almost exactly)
>wake up at 6AM
:I
|
|
|
|
|
|
|
|
|
|
|
|
|
|
|
|
|
|